Edge of Chaos: Self-Organized Criticality
In the paper, Self-Organized Criticality: An Explanation of 1/f Noise, authors show a very simple iterative procedure which generates some interesting results. This procedure is quite easy to code up and we can verify the results. What is this procedure and what’s so interesting about the results anyway? Let’s dive into it.
Consider an integer array $z$, that uses the following evolution rule if for any $(x, y)$, $z(x, y) > 4$:
\[z(x, y) \longrightarrow z(x, y) - 4,\] \[z(x \pm 1, y) \longrightarrow z(x \pm 1, y) +1,\] \[z(x, y \pm 1) \longrightarrow z(x, y \pm 1) +1,\]You can think of the array as ‘sand pile’ where if the height at a point, $z(x, y)$ is greater than 4, pile collapses at that point and spreads the sand to the neighboring points. This continues until all the values of the array are below 4. We want to count how many steps before the array settles down. Let’s write code to run this:
import numpy as np

def evolve(arr, critical=4):
    """
    Evolves the arr for one time step.
    Returns False if the system is stable.
    """
    bad_x, bad_y = np.where(arr >= critical)
    try:
        bad_x = bad_x[0]
        bad_y = bad_y[0]
        arr[bad_x, bad_y] = arr[bad_x, bad_y] - 4

        if bad_x > 0:
            arr[bad_x - 1, bad_y] = arr[bad_x - 1, bad_y] + 1

        if bad_y > 0:
            arr[bad_x, bad_y - 1] = arr[bad_x, bad_y - 1] + 1

        if bad_x < arr.shape[0] - 1:
            arr[bad_x + 1, bad_y] = arr[bad_x + 1, bad_y] + 1

        if bad_y < arr.shape[1] - 1:
            arr[bad_x, bad_y + 1] = arr[bad_x, bad_y + 1] + 1

        return True
    except IndexError:
        return False


def evolve_until_stable(arr):
    """
    Evolve the array until it is stable.
    Return number of steps to the stability.
    """
    num_steps = 1
    while evolve(arr):
        num_steps = num_steps + 1

    return num_steps
Let’s initialize the array randomly with a large maximum value and evolve it until stable.
n = 20
arr = np.random.randint(low=0, high=10, size=(n, n))
evolve_until_stable(arr)
Array stops evolving when it is barely stable. Authors of the above paper call this state ‘self-organized criticality’. This is how it looks like:
Self organized criticality
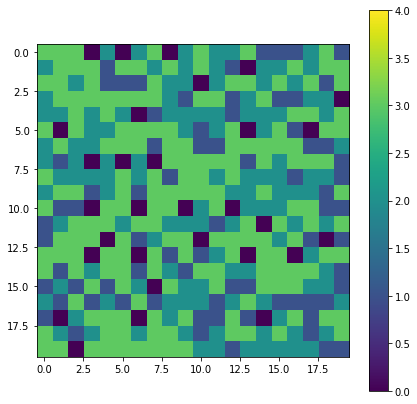
How does adding another ‘sand grain’ to this state i.e. $z(x, y) \rightarrow z(x, y) + 1$, affect the system? If the grain falls at the places where height is <3, nothing happens. We can see that there are a fair bit of 3s are next to each other. If the sand grain falls on these clusters, they can cause a chain reaction (‘avalanche’) dramatically changing the state!
An avalanche
Let’s keep on adding sand grains at random places and measure the distribution of sizes of avalanches.
def perturb(arr):
    x = np.random.randint(low=0, high=arr.shape[0])
    y = np.random.randint(low=0, high=arr.shape[1])
    arr[x, y] = arr[x, y] + 1

# generate a self organized criticality
n = 20
np.random.seed(0)
arr = np.random.randint(low=0, high=10, size=(n, n))
evolve_until_stable(arr)

num_sim = int(1e5)

# perturb and measure the avalanche sizes.
avalanche_sizes = []
for _ in range(num_sim):
    perturb(arr)
    avalanche_size = evolve_until_stable(arr)
    avalanche_sizes.append(avalanche_size)
Let’s draw the histogram of avalanche_sizes:
Avalanche sizes
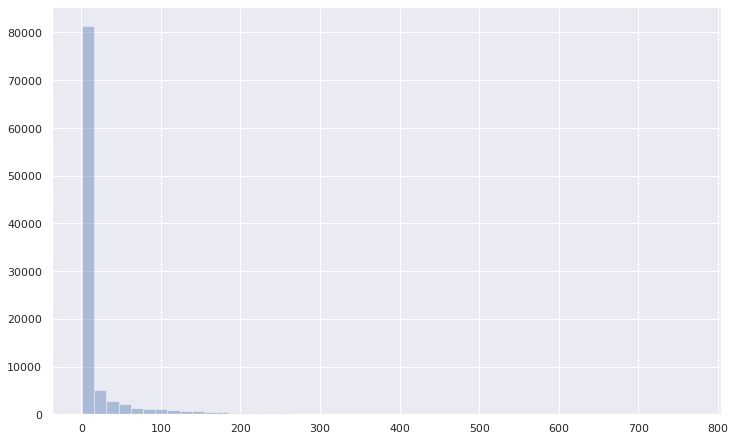
Most of the avalanches are small but there are a few really large avalanches. Nothing special right? Let’s change both the axes to log.
Power law
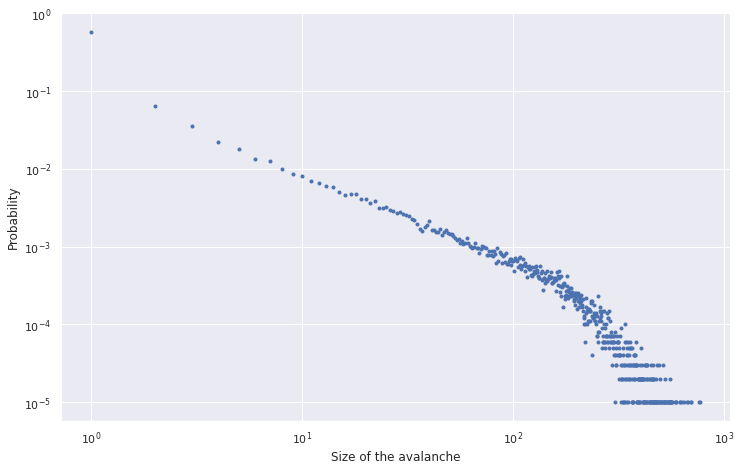
That’s weird – we see a line! Tail does not follow the line exactly because of boundary effects and sampling errors (sample size is $10^5$ in this case). If we represent the size of avalanche by $n$, we have
\[\log{p(n)} = c - \alpha \log{n},\] \[p(n) = e^{(c - \alpha \log{n})},\] \[p(n) = p_0 n^{-\alpha}.\]This distribution is what is called power law. There are a lot of names to this distribution: mathematicians call it pareto distribution, while physicians call it $1/f$ noise. It shows up in lot of places from economics, geology to world wide web. Pareto law, which states 20% events cause 80% consequences follows from the power law.
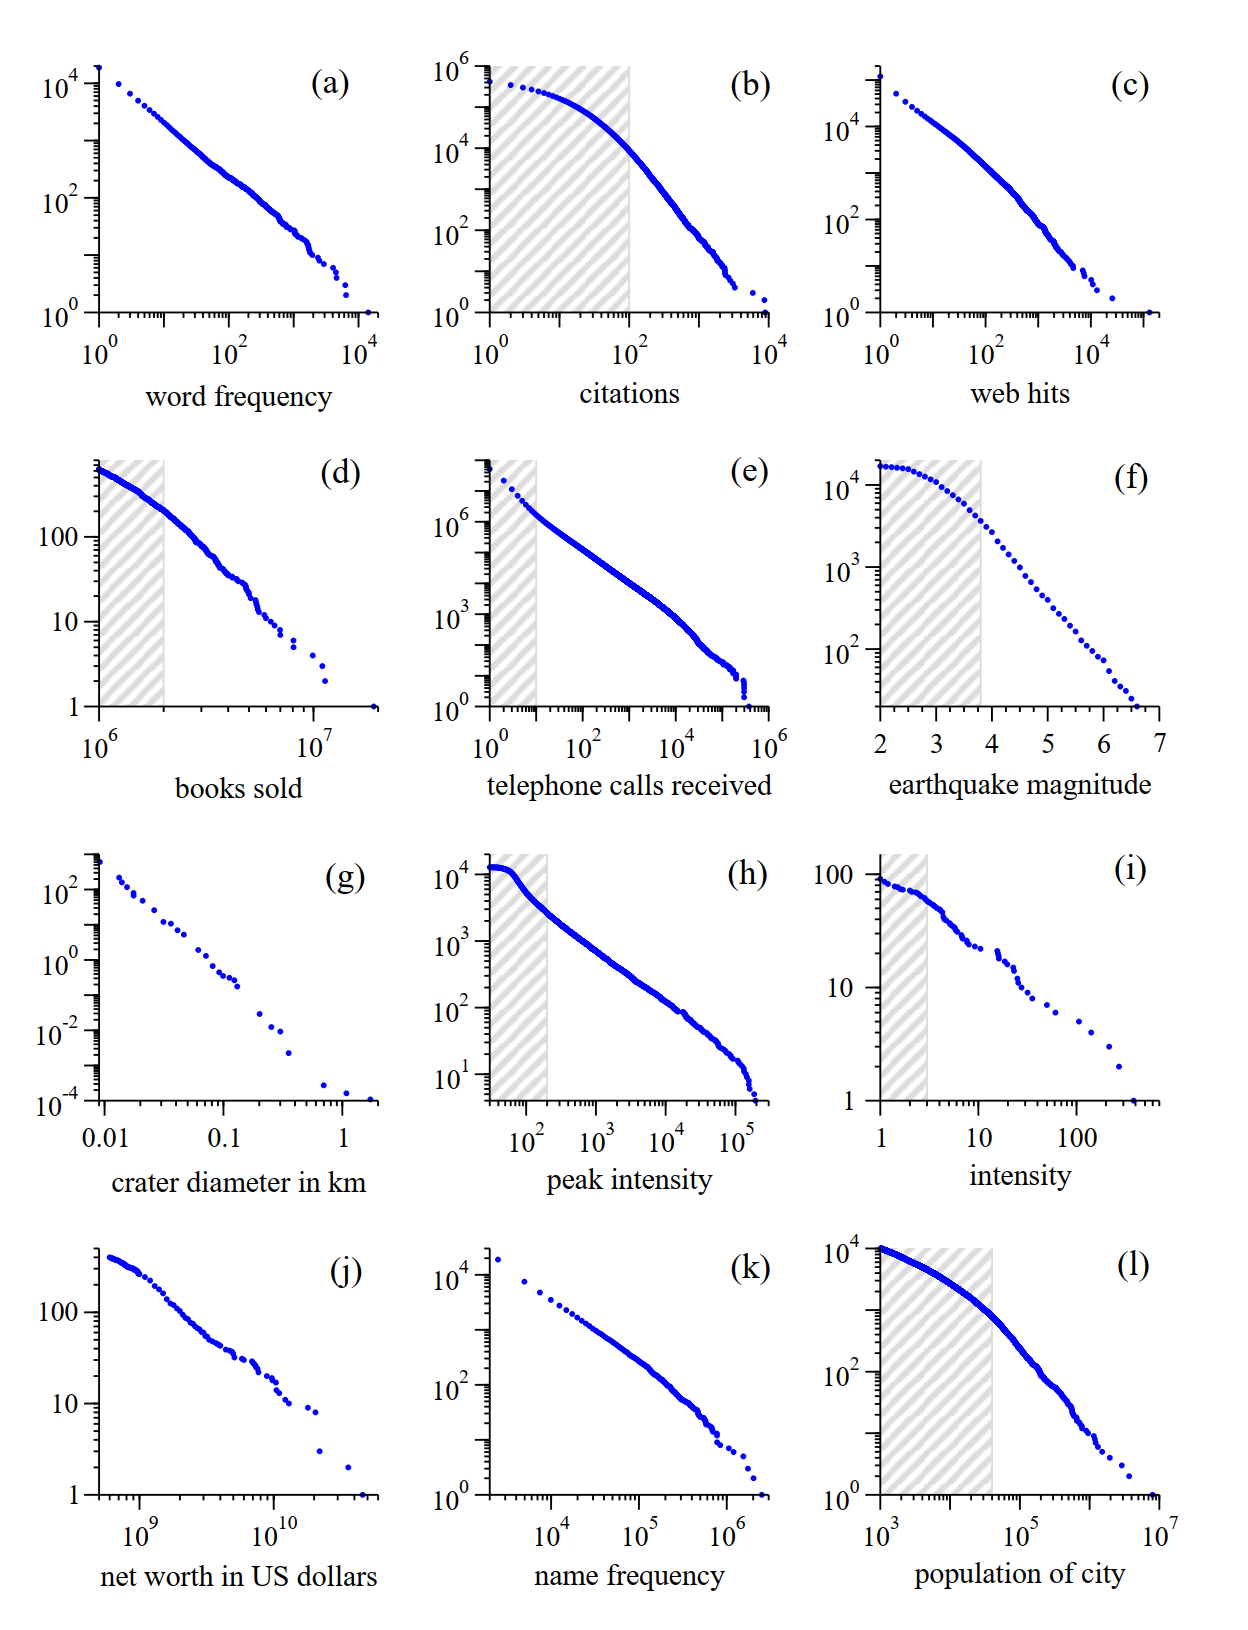
Cumulative distributions or “rank/frequency plots” of twelve quantities reputed to follow power laws. Source references for the data are given in the text. (a) Numbers of occurrences of words in the novel Moby Dick by Hermann Melville. (b) Numbers of citations to scientific papers published in 1981, from time of publication until June 1997. (c) Numbers of hits on web sites by 60 000 users of the America Online Internet service for the day of 1 December 1997. (d) Numbers of copies of bestselling books sold in the US between 1895 and 1965. (e) Number of calls received by AT&T telephone customers in the US for a single day. (f) Magnitude of earthquakes in California between January 1910 and May 1992. Magnitude is proportional to the logarithm of the maximum amplitude of the earthquake, and hence the distribution obeys a power law even though the horizontal axis is linear. (g) Diameter of craters on the moon. Vertical axis is measured per square kilometre. (h) Peak gamma-ray intensity of solar flares in counts per second, measured from Earth orbit between February 1980 and November 1989. (i) Intensity of wars from 1816 to 1980, measured as battle deaths per 10 000 of the population of the participating countries. (j) Aggregate net worth in dollars of the richest individuals in the US in October 2003. (k) Frequency of occurrence of family names in the US in the year 1990. (l) Populations of US cities in the year 2000. Source: Newman, Mark EJ. “Power laws, Pareto distributions and Zipf’s law.” Contemporary physics 46.5 (2005): 323-351.
Perturbations to a minimally stable state seems to be generating an universal: power laws. Is this the mechanism underlying the complex systems like earthquakes and life?
This idea is not new. Ilya Prigogine, a physicist and Nobel laureate Stuart Kauffman, a mathematical biologist suggest that life and other complex systems seem to be operating at edge of chaos and order. Author of the paper in question, Per Bak goes as far as to suggest brain is a self-organized criticality. I wonder if we’ll ever get to the answer!